Shin-Duck Lee♦ and Yeon-Woo Jeong*
Algorithm for Generating AI Geo-Fence of Satellite Communication Network Using Multi-Dimensional SVM Model
Abstract: In this paper, we propose a method for creating an AI-based geo-fence using satellite communication networks to predict the location of terminals in advance and quickly switch between satellite networks in shadow areas of the TN network and TN networks where they exist. To achieve this goal, we used a multi-dimensional support vector machine (SVM) model to create an AI-based geo-fence and confirmed that classification accuracy was secured above a specified level (e.g., 98%).
Keywords: satellite communication network , geo-fence , multi-dimensional SVM
Ⅰ . Introduction
Since the commercialization of the 4G communication system, efforts have been made to develop an improved 5G communication system or pre-5G communication system to meet the increasing demand for wireless data traffic. For this reason, the 5G communication system or pre-5G communication system is referred to as a beyond 4G network communication system or a post-LTE system. To achieve high data transmission rates, the implementation of the 5G communication system in the ultra-high frequency (mmWave) band (e.g., bands above 6 GHz) has also been considered in addition to the band used by LTE (bands below 6 GHz). In the 5G communication system, technologies such as beamforming, massive multiple-input-multiple-output (MIMO), full-dimensional MIMO (FD-MIMO), array antennas, analog beamforming, and large-scale antennas are being discussed. Recently, the fifth-generation communication system considers providing communication services using not only fixed base stations on land but also entities that are not fixed on land. The fifth-generation communication system considers implementing cellular communications using satellites, performs cellular communications using satellites while having difficulty connecting with base stations, and satellite-based cellular communications may implement wider coverage than cellular communications using base stations due to the characteristics of moving satellites in Earth's orbit. Satellite-based cellular communications are attracting attention in terms of reducing shadow areas where communication services cannot be provided. With recent advances in satellite communication technology, efforts are actively underway to provide communication services even in regions beyond the coverage area of ground networks. Such non-terrestrial networks play an important role in expanding access to communication services, but there are challenges to be addressed in terms of interworking with terrestrial networks and efficient resource management. When a terminal moves to a shadow region of a ground network and needs to switch to satellite communication, previously, it had to go through a process of searching the entire network (full scanning) to register with the satellite network. This full-scanning process may cause latency and increase power consumption at terminals. Also, continuous search of the ground network's band during satellite communication services causes unnecessary power consumption, and immediate network switching back to the ground network may be difficult. Therefore, this paper proposes an AI geo fence generation algorithm for satellite communication networks using a multi-dimensional SVM model. While linear SVM or logistic regression models are computationally simple and can process data quickly, they have limitations in handling nonlinear and complex data. In contrast, multi-dimensional SVM can solve nonlinear problems, demonstrating superior performance in complex satellite communication environments. Non-linearly distributed data to higher dimensions, it ensures high accuracy even with intricate patterns or boundaries in the data. Given that the propagation environment in satellite communications is highly nonlinear, multi-dimensional SVM effectively addresses nonlinear challenges through the kernel trick. Consequently, it enables more sophisticated predictions compared to traditional linear models or other techniques. However, the use of multi-dimensional SVM cannot always be considered efficient. Especially in satellite communication systems, where low latency and high processing speeds are essential, it is necessary to design models that minimize computational overhead.
In this paper, we propose an algorithm that predicts the location of a terminal in advance by creating an AI geo-fence for satellite communication networks using multi-dimensional SVM models and analyze its performance through simulations.
Ⅱ . An Algorithm for Generating Satellite Communication Network AI geo-fence using proposed Multi-Dimensional SVM Model
Figure 1 shows the division of regions connected to the terrestrial network and those connected to the non-terrestrial network using geo-fence.
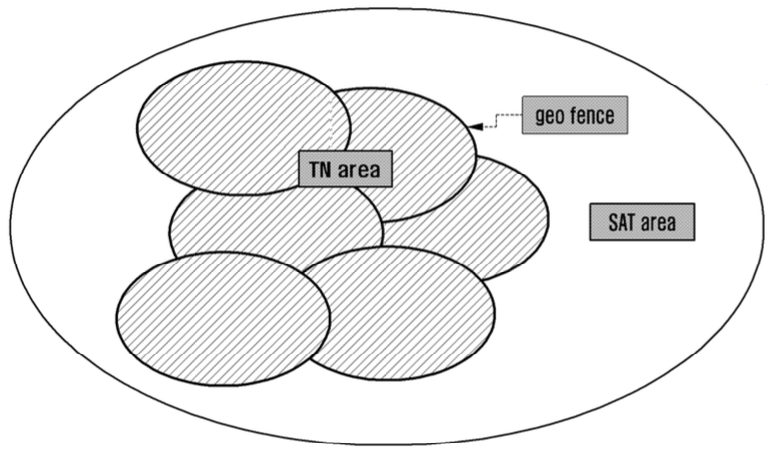
This intentionally illustrates the boundaries and coverage areas of terrestrial networks (TN) and non-terrestrial networks (e.g., satellite networks, SAT) to emphasize their complementary relationship. In reality, terrestrial network coverage areas exhibit irregular and complex shapes due to varying terrain and range, and physical obstacles or signal degradation can create shadow regions. However, for intuitive representation of both TN and SAT networks, the diagram depicts terrestrial network zones as multiple elliptical shapes contained within the broader coverage area of non-terrestrial satellite networks (SAT). While terrestrial networks (TN) typically provide high capacity coverage in urban and accessible areas, the shadow regions beyond TN's reach can be covered by non-terrestrial satellite networks (SAT). The diagram employs geo-fencing to clearly distinguish between areas connected to terrestrial networks (TN) and those served by non-terrestrial satellite networks (SAT). “Out of synchronization (OOS)” refers to a situation where electronic devices lose synchronization with the terrestrial network, indicating loss of network signals or unstable connections. The term “satellite mode (SAT mode)” refers to a mode in which communication is performed via satellites instead of the terrestrial network. Global Navigation Satellite System (GNSS) is a global positioning system utilizing satellites, whereas AI geo-fence utilizes artificial intelligence to set up virtual geographical boundaries for monitoring and defining certain areas. Figure 1 shows the division of regions connected to the terrestrial network and those connected to the non-terrestrial network using geo-fence. This intentionally illustrates the boundaries and coverage areas of terrestrial networks (TN) and non-terrestrial networks (e.g., satellite networks, SAT) to emphasize their complementary relationship. In reSatellite public land mobile network (SAT PLMN) is a public land mobile network that provides mobile communication services via satellites, and Full Scanning involves searching all available networks, taking longer than typical network scan operations. Therefore, when movement is detected through an accelerometer sensor, the device uses GNSS coordinates and velocity information to predict movement towards a terrestrial network region; upon detecting entry within the geo-fence, it searches for public land mobile network (PLMN) and registers with the terrestrial network.
When setting up a geo-fence using a trained multi-dimensional model, the distinction between the service areas of ground networks and satellite networks creates non-linear boundaries. Among nonlinear models, support vector machine (SVM) is one of the classification algorithms in machine learning, which maps data to high-dimensional feature spaces to create complex nonlinear boundaries. This learned model is widely used for various classification problems[1]. This paper uses kernel functions to transform input data into high-dimensional space, effectively classifying data that is difficult to distinguish linearly through an algorithm called multi-dimensional SVM, which sets up complex boundary shapes distinguishing the service area of ground network and satellite network.
When setting up a geo-fence using a trained multi-dimensional model, the distinction between the service areas of ground networks and satellite networks creates non-linear boundaries. Among nonlinear models, support vector machine (SVM) is one of the classification algorithms in machine learning, which maps data to high-dimensional feature spaces to create complex nonlinear boundaries. This learned model is widely used for various classification problems[1]. This paper uses kernel functions to transform input data into high-dimensional space, effectively classifying data that is difficult to distinguish linearly through an algorithm called multi-dimensional SVM, which sets up complex boundary shapes distinguishing the service area of ground network and satellite network.
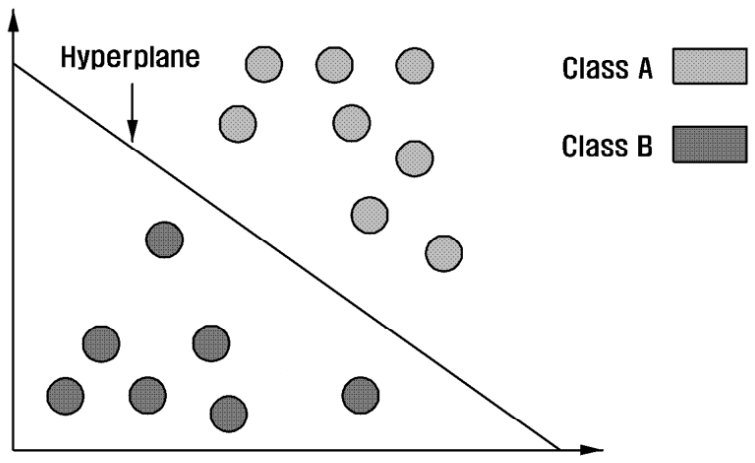
Figure 2 illustrates the process of classifying data using a hyperplane, where multiple classes (e.g., class A and class B) can be distinguished using a hyperplane. It's worth noting that class A and class B are just examples, and there is no limitation on the number and types of data classes. For example, linear classification can be performed on a two-dimensional plane, determining that data points corresponding to Class A are distributed above the hyperplane, while those corresponding to Class B are distributed below the hyperplane. Hyperplanes refer to subspaces of dimension n-1 that divide n-dimensional space into two regions; they appear as lines in 2D space, planes in 3D space, and generalized forms in higher dimensions. In SVM, hyperplanes serve as decision boundaries for classifying different classes of data, being set in a direction that maximizes the margin between the two classes.
This linear support vector machine (SVM) model operates by linearly separating each data class, but in complex data distributions, the boundaries between multiple classes cannot be separated linearly as we can see from the data samples in Figure 3. In other words, depending on the characteristics of the data, higher-dimensional nonlinear boundaries may be required. For data with a multilayer structure or nonlinear relationships, linear models cannot reflect such complex relationships, potentially leading to degraded classification performance. As a result, linear model may be unsuitable or significantly underperform in multi-class problems. Therefore, based on Linear support vector machine (SVM) model, but in actual implementation, we apply the kernel trick to the maximum margin hyperplane problem proposed in 1992 for non-linear classification, applying the radial basis function (RBF) kernel function to map data into high dimensional space and perform classification[2,3]. In this paper, we use the RBF kernel to accurately distinguish between the service areas of terrestrial networks (TN) and satellite networks, which are difficult to classify simply linearly due to their geographical characteristics. Expanding upon this, we utilize a multi-dimensional SVM model capable of nonlinear classification to effectively model complex geo-fences. Considering the characteristics of terrain or TN coverage ranges that are not fixed and exhibit irregular shapes, we employ a SVM model. We primarily apply the kernel at this stage because it allows us to learn complex nonlinear boundaries efficiently. By utilizing the RBF kernel, we can model irregular network coverages caused by factors such as mountainous terrains or shadowed urban buildings.
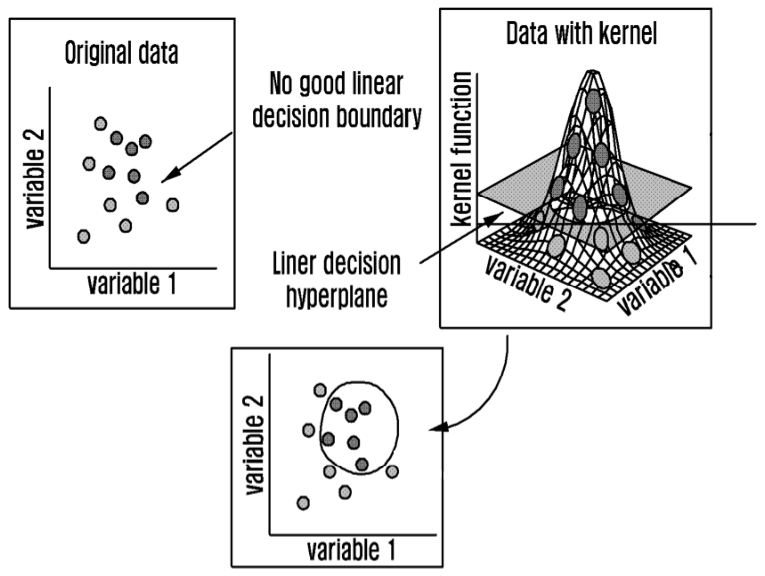
To establish an AI-based geo-fence as described in this paper, rather than relying solely on 2D classification, we leverage the kernel trick to elevate intricate patterns drawn on a flat surface into three dimensions, revealing clearer patterns. This involves transforming low-dimensional complex data into higher dimensions, making classification easier. For instance, when dividing urban and suburban areas along winding borders, projecting these onto a third dimension may result in clean separation surfaces. Compared to conventional linear models, the multi-dimensional SVM model achieves high accuracy even with small amounts of training data[4], operates stably despite of errors in GNSS signals or temporary network instability, and has fewer risks of overfitting, allowing effective generalization to new locations. Through the RBF kernel, it actually works in an infinite-dimensional feature space. Therefore, by employing a multi-dimensional SVM model, we expand the complexity of geometric figures on a 2D plane into higher dimensions such as 3D or 4D, thereby finding the most appropriate demarcation line. As shown in Figure 4, when data is distributed, adjusting the gamma value controls the strength of transformation, enabling more complex borderline learning as the gamma value increases.
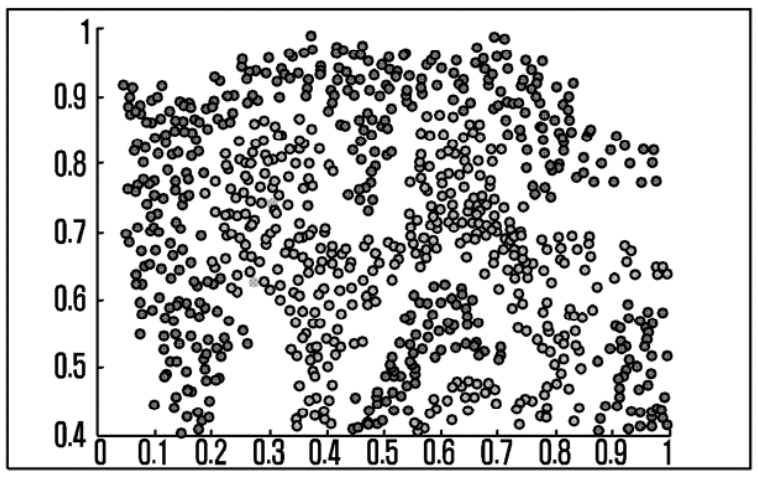
Figure 5 illustrates the change in decision boundaries according to the gamma value through visual representation.
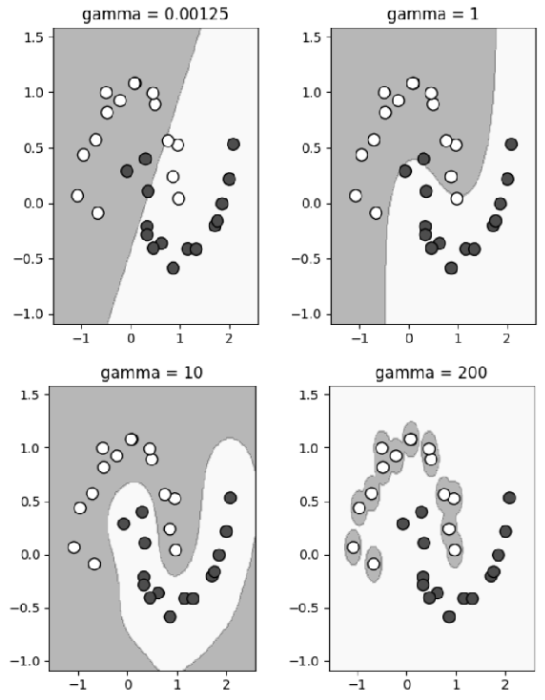
Figure 6 demonstrates classified data resulting from this learning process.
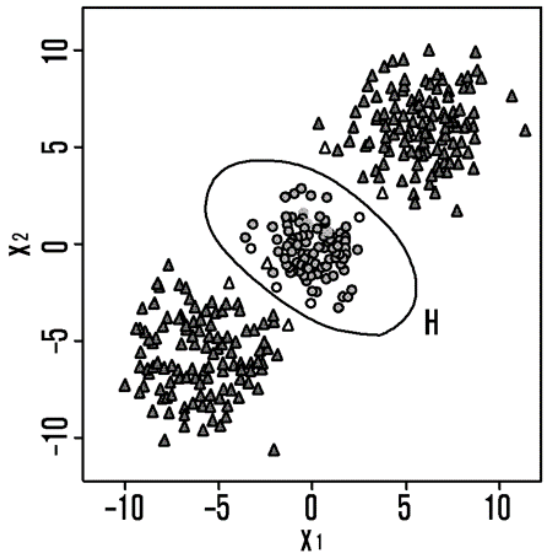
Figure 7 depicts the schematic representation of creating and training a multi-dimensional SVM model.
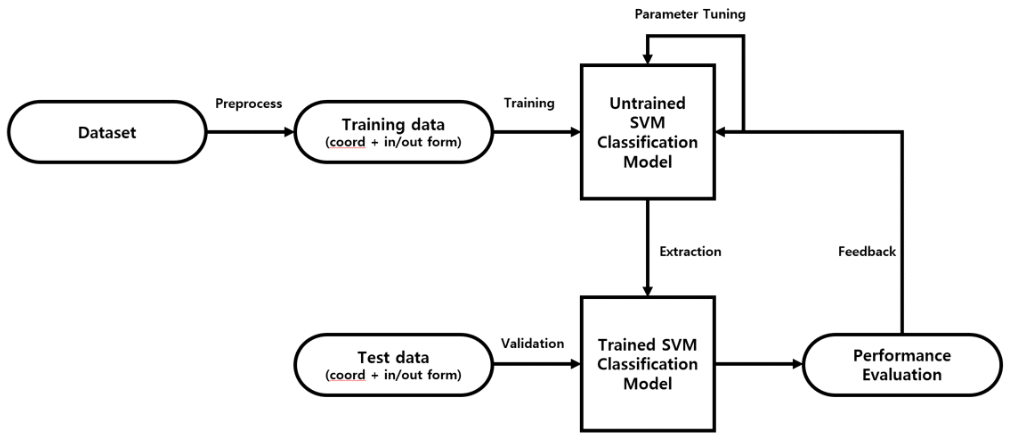
Table 1.
| Abbreviation | Description |
|---|---|
| TN | terrestrial networks |
| SAT | satellite |
| OOS | out of synchronization |
| SVM | support vector machine |
| RBF | radial basis function |
| GNSS | global navigation satellite system |
| AI | artificial intelligence |
| PLMN | public land mobile network |
| 2/3/4 D | 2/3/4 dimensional space |
Ⅲ. Performance Analysis and Conclusions
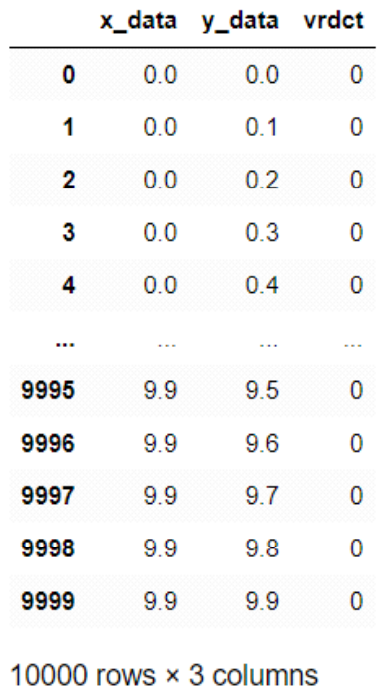
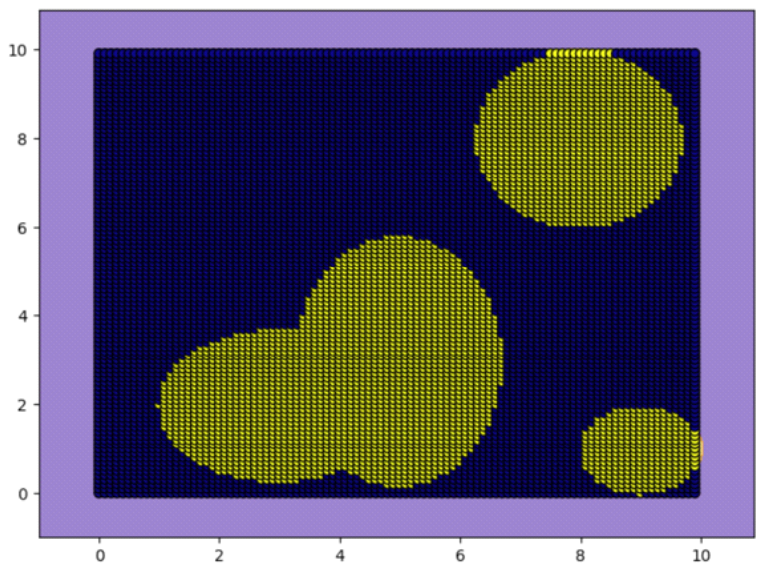
In order to conduct performance analysis experiments, Figure 8 samples GPS coordinates at intervals of 0.1 within a 10 × 10 grid to construct the training dataset of 10,000 units.
This simulation divides imaginary region similar with latitude and longitude, labeling them either as part of the Terrestrial Network (TN) or satellite network according to elliptical equations defining respective zones.
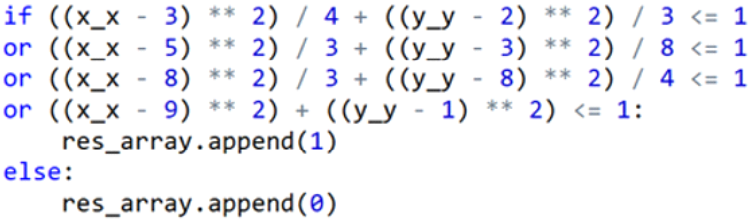
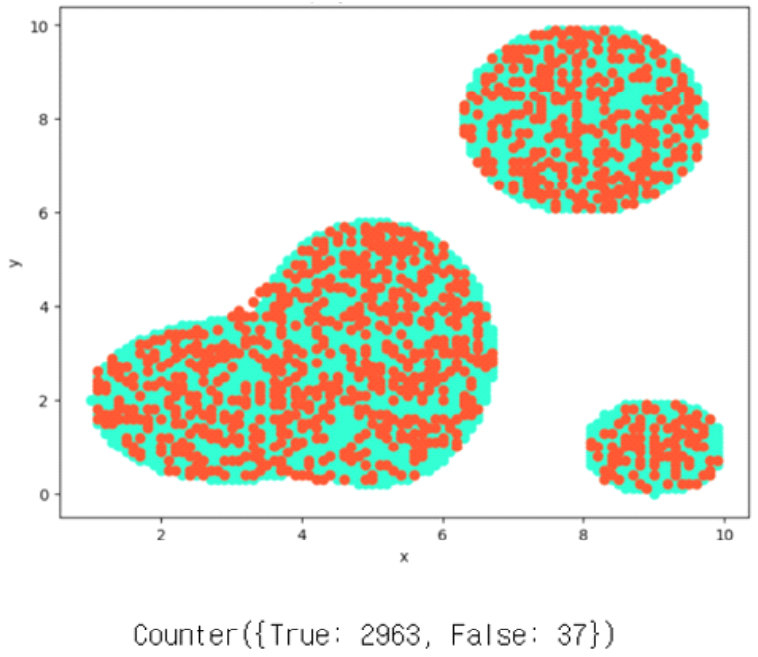
Figure 9 generates four graphs - three ellipses and one circle - for performance analysis testing purposes via this method.
Fig. 9.
To effectively differentiate data, kernel functions are applied to map data into high-dimensional spaces. During this process, the kernel function transforms data into a 3D space, then projects transformed high-dimensional data back onto a 2D plane. Data points can now be effectively separated by multi-dimensional boundaries, generating curved decision boundaries instead of simple linear ones, thus accurately categorizing complex datasets. Using this methodology, we apply the RBF kernel to create an AI-powered geo-fence that distinguishes between satellite communication networks and terrestrial networks (TN).
This paper utilizes the RBF kernel to map 2D input data consisting of GNSS coordinates into a feature space. Specifically, for coordinate pairs (x, y),
we convert them into an infinite-dimensional feature space using the equation. Once mapped into this space, what were previously nonlinear boundaries become linear representations. The hyperplane serves as the boundary separating the terrestrial network area from the satellite network area, and by reversely converting the hyperplane back into the original 2D space, we generate a complex curvilinear decision boundary. That is, we calculate the similarity between data points using the RBF kernel and mathematical formula.
Here, the γ (gamma) value determines the complexity of the decision boundary; setting γ = 0.1 results in a gentle decision boundary, whereas γ = 1.0 yields a more complex one. In other words, the gamma value determines how well the model fits the data or whether it faces issues of overfitting or under fitting. A high gamma value narrowly defines the similarity between data points, causing the kernel function to respond strongly to specific data points. This results in highly intricate and complex decision boundaries, making the model overly sensitive to training data and increasing the risk of overfitting. Consequently, the model becomes too tailored to the training data, potentially leading to diminished generalization performance. A small gamma value broadly defines the similarity between data points, causing the kernel function to respond to a wider range of data points. This results in smoother and simpler decision boundaries, but it increases the risk of under fitting, as the model may fail to capture the finer details of the training data, potentially leading to reduced generalization performance. The hyper parameter gamma value, which controls the model's complexity, represents merely an illustrative case and can vary depending on settings; parameter tuning optimizes model performance, involving adjustments to kernel type, C-value, and gamma among other parameters, all fed back into our multidimensional SVM model. Dynamic tuning of parameters such as C-values for kernels or gamma values for decision boundaries accounts for complex urban environments shaped by building structures versus simpler rural landscapes. Adjustable between values over 0 to infinite, larger gamma values yield increasingly convoluted decision boundaries. Through iterative learning and validation processes, we generate an AI geo-fence model exhibiting relatively higher accuracy compared to pre-training levels. Figure 8 constructs a 2D vector from each GNSS coordinate's x-coordinate and y-coordinate, labels whether the location is accessible by network with binary values (1 or 0), forming a training dataset. Then, as depicted in Figure 10, this dataset trains the multi-dimensional SVM model, model_f, using inputted training data (X_train and y_train). Herein, X_train represents position coordinates composed of (x_data, y_data) while Y_train indicates the inclusion status of the service area at said coordinates, performing the task of teaching the model outcomes given inputs (X_train(coordinates) → Y_train(classification)).
Fig. 10.
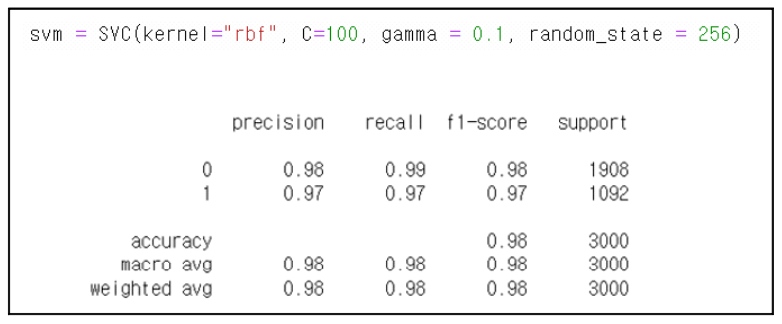
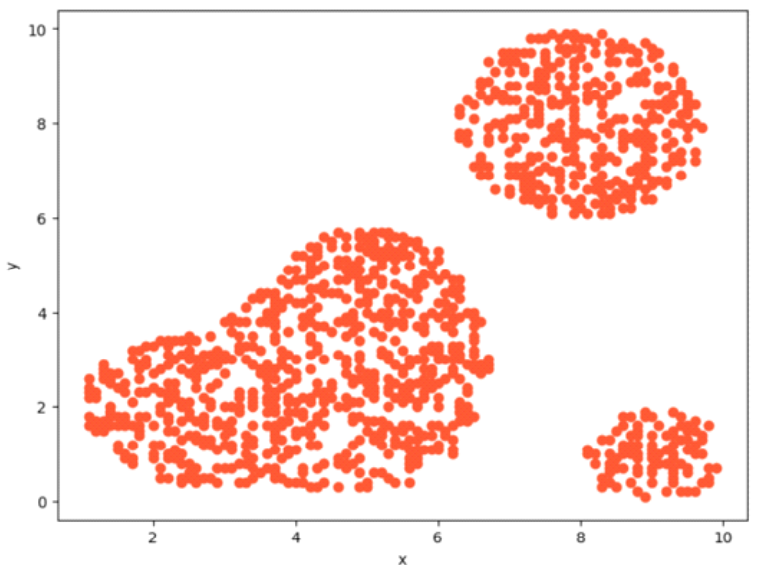
We predict test data using the trained model with pred_y = svm.predict(X_test) function. That is, we feed test coordinates represented as tuples of (x_data, y_data) into X_test to determine whether the specified location falls within the designated service zone. Additionally, we assign a penalty for error by configuring C to 100. With default C equaling 1.0, it acts as a parameter deciding how much misclassification tolerance allows[5]. To execute multiclass classification, we configure the kernel option as 'rbf', short for radial basis function'. Kernel options include choices like 'rbf', 'linear', 'poly', and 'sigmoid'; currently implemented, we select 'rbf' suitable for multidimensional classification, setting degree to 5 to define polynomial rank. Degree signifies the rank of polynomial kernels, random state ensures reproducibility at 256. Gamma adjusts potential occurrence of overfitting affecting decision boundaries, defaults to 'scale,' while Coef0 denotes constant term in polynomial kernels, defaulting to 0.0. Evaluating the trained model's performance via test dataset, we label every GNSS Coordinate as belonging either to ground net area or satellitia net zone, generating a classification model accordingly. For instance, assuming the present location is (37.5665, 126.9780), if the model outputs 1, it selects the land network; otherwise, if it outputs 0, it chooses the satellite network. Consequently, examining experimental performance reveals an f1-score reaching approximately 0.98 indicating secured efficacy at around 98%. Following creation of the support vector machine model, studying & predicting data displays initial training data (X_train, y_train) illustrated in Figure 12. Moreover, visual verification shows overlap between Figures 9 (original data) and 11 (training data), representing similarities at 98%
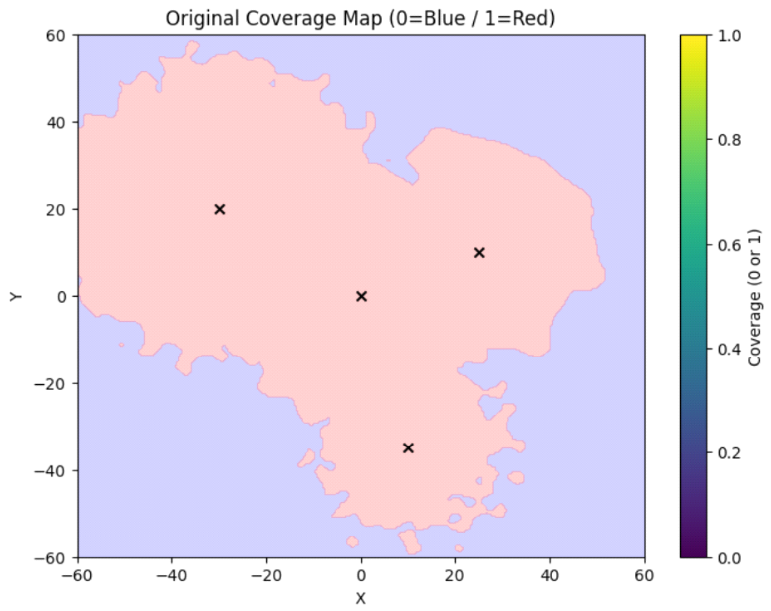
As an additional experiment, applying the perlin-noise algorithm[6] with random patterns generates more realistic terrain-like data similar to Figure 13. This results in spherical-shaped terrains being transformed into forms with random patterns due to the applied noise.
To find suitable parameters for the multi-dimensional SVM model, we set up grid search and perform 5-fold cross validation for each parameter to avoid overfitting. Then, evaluate the performance of the parameter combinations and select the one with the best performance as shown in Figure 14.
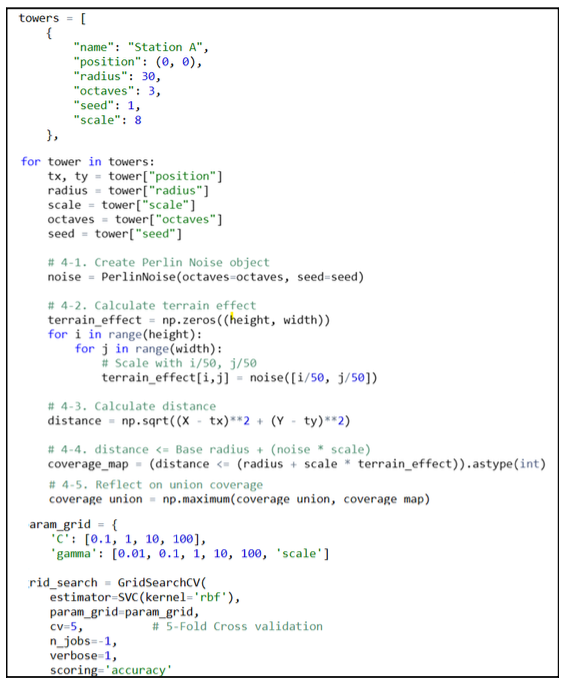
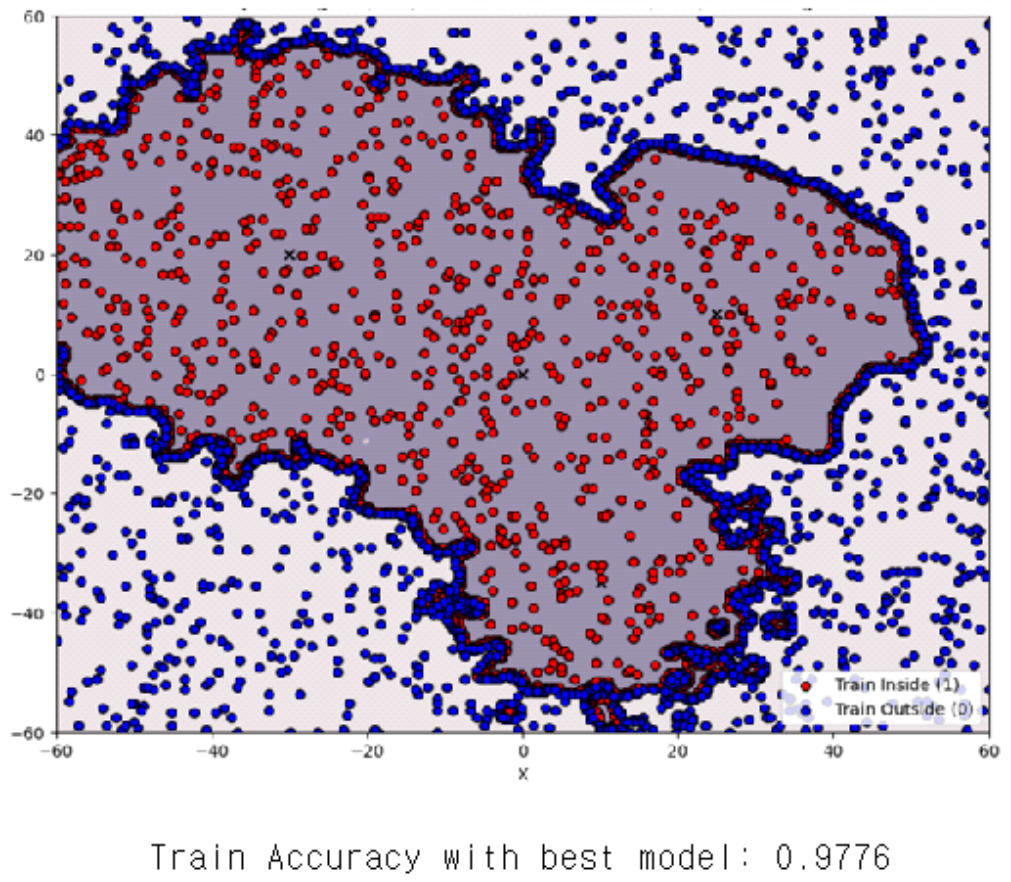
Figure 15 shows that when the optimal model selected through 5-fold cross-validation test is trained on a dataset of 90,000 units, an accuracy of 97.76% is achieved.
Various methods have been used to implement multi-dimensional SVM models, including one-vs-one[7], one-vs-rest[8], error-correcting output codes[9] and structured SVM[10]. The approach proposed in this paper is designed by reflecting the constraints of satellite communication environments, particularly in geo-fence based satellite operation scenarios. In geo-fencing situations, rapidly changing regional information, limited data links, and high cost communication resources play crucial roles. Accordingly, this study proposes an optimized SVM based approach that simultaneously considers computational resource efficiency and real time classification feasibility. Therefore, it can be proven that fast switching between satellite networks in shadow areas of the TN network and the TN network in areas where the TN network exists is possible with high accuracy (e.g., 98%) through the AI geo-fence algorithm using multi-dimensional SVM. This result provides important implications for automated decision making and resource reallocation scenarios of satellites based on geo-fence events. However, this paper implementation only requires binary classification to distinguish between inside and outside the mobile communication network area, eliminating the need for multi-class classification. In subsequent studies, we plan to further analyze the applicability of hybrid approaches reflecting various class interactions or online learning based multi-dimensional SVM.
Biography

Biography

References
- 1 I. Joe and H.-T. Shim, "A SVM-based spam filtering system for short message service (SMS)," J. KICS, vol. 34, no. 9, pp. 908-913, 2019. (https://koreascience.kr/article/JAKO20093306 3799701.page)custom:[[[-]]]
- 2 M. Aizerman, E. Braverman, and L. Rozonoer, "Theoretical foundations of the potential function method in pattern recognition learning," A utomat. and Remote Control, vol. 25, pp. 821-837, 1964. (https://cs.uwaterloo.ca/~y328yu/classics/kerne l.pdf)custom:[[[-]]]
- 3 B. E. Boser, I. M. Guyon, and V. N. Vapnik, "A training algorithm for optimal margin classifiers," in Proc. Fifth Annual Wkshp. COLT '92, pp. 144-152, 1992. (https://doi.org/10.1145/130385.130401)doi:[[[10.1145/130385.130401]]]
- 4 C. Cortes and V. Vapnik, "Support-vector networks," Machine Learn., vol. 297, pp. 273-297,1995. (https://doi.org/10.1007/BF00994018)doi:[[[10.1007/BF00994018]]]
- 5 N. T. Renukadevi and P. Thangaraj, "Performance evaluation of SVM - RBF kernel for medical image classification," Global J. Computer Sci. and Technol., Graphics Vision, vol. 13, no. 4, 2013. (https://globaljournals.org/GJCST_Volume13/3 -Performance-Evaluation.pdf)custom:[[[-]]]
- 6 K. Perlin, "An Image synthesizer," ACM SIGGRAPH Computer Graphics, vol. 19, no. 3, pp. 287-296, 1985. (https://doi.org/10.1145/325334.325247)doi:[[[10.1145/325334.325247]]]
- 7 R. Rifkin and A. Klautau, "In defense of one-vs-all classification," J. Machine Learn. Res., vol. 5, pp. 101-141, Jan. 2004. (https://www.jmlr.org/papers/volume5/rifkin04a /rifkin04a.pdf)custom:[[[-]]]
- 8 C.-W. Hsu and C.-J. Lin, "A comparison of methods for multi-class support vector machines," IEEE Trans. Neural Netw., vol. 13, no. 2, pp. 415-425, Mar. 2002. (https://doi.org/10.1109/72.991427)doi:[[[10.1109/72.991427]]]
- 9 T. G. Dietterich and G. Bakiri, "Solving multiclass learning problems via errorcorrecting output codes," J. Artificial Intell. Res., vol. 2, pp. 263-286, 1995. (https://doi.org/10.1613/JAIR.105)doi:[[[10.1613/JAIR.105]]]
- 10 N. Ghamrawi and A. McCallum, "Collective multi-label classification," in Proc. 14th ACM CIKM, pp. 195-200, Bremen, Germany, 2005. (https://doi.org/10.1145/1099554.1099591)doi:[[[10.1145/1099554.1099591]]]